|
5.6 The Sorted Colored Maps for the Converging Sequence of Correlation Matrices
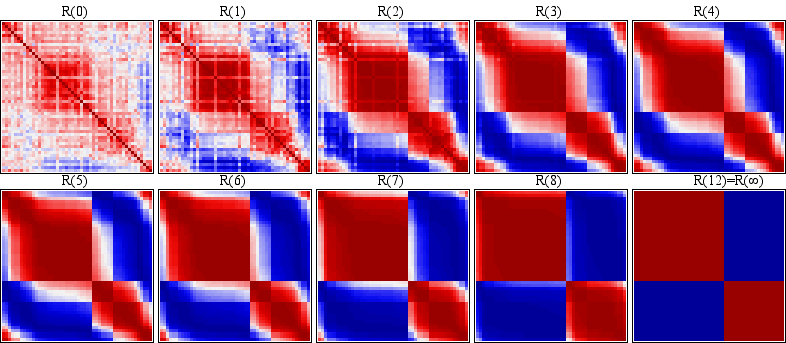
It would be quite interesting to be able to visualize the formation of the clusters step by step when investigating a clustering problem. Both the eigenvector-plots and the colored maps of the converging sequence provide the users with this piece of grouping information. There are some observations to be noted herein for the sequence of the correlation maps.
Fifty symptoms are arranged using the rank-2 elliptical seriation before plotting the sequence of correlation maps in Figure 8a. For the original correlation map in Figure 8a , each individual column keeps its own characteristics although several potential groups are forming at this very beginning status. From Figure 8a to the converged correlation map in Figure 8a , each individual column keeps its own characteristics although several potential groups are forming at this very beginning status. From Figure 8a to the converged correlation map in Figure 8a is a dynamic grouping process. The problem now is that how to utilize the visual information in the sequence of eigenvector-plots and correlation maps for studying the dynamic clustering process. is a dynamic grouping process. The problem now is that how to utilize the visual information in the sequence of eigenvector-plots and correlation maps for studying the dynamic clustering process.
(a)
(b)
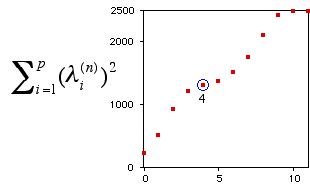
Figure 8. (a). Sorted (by the Rank-2 Ellipse Order) Maps for the Converging Sequence of Correlation Matrices; (b). Plot of the Sequence of Summations of Squared Eigenvalues for each Iteration for the Fifty Symptoms.
There is no rigorous rule. However, we do have the following suggestions. It is important to pay attention to both the within-group structure and the between-group difference while searching for clustering. For example, in Figure 8a , it is observed that all the within-group (main diagonal) correlations are high and homogeneous (dark red) while the between-group (off diagonal) structures all come with sharp edges. Usually this mature status can be identified with the help of the plot of the summation of squared eigenvalues at each iteration as in Figure 8b. , it is observed that all the within-group (main diagonal) correlations are high and homogeneous (dark red) while the between-group (off diagonal) structures all come with sharp edges. Usually this mature status can be identified with the help of the plot of the summation of squared eigenvalues at each iteration as in Figure 8b.
This sequence of summations of squared eigenvalues generally has an increasing trend. We look for the iterations where this trend of increasing slows down (exclude the iterations right before the converged status). At theses iterations the individual coefficient does not change much which means the centering and product steps have no effect on them. This occurs when the process reaches at a near stationary status where the formation of groups is mature. It is similar to the trap of a perfect symmetry structure. In Figure 8b, this occurs at iterations 4 and 5. Started from iteration 7, this balanced status is broken down and the process converges to the two winners and trapped there. There are five major groups with minor substructure in Figure 8a . They are named V1 (TH3-BE2) for thought disorder symptoms, V2 (NA6-ND2) for negative symptoms, V3 (DL1-DL8) for auditory hallucination symptoms, V4 (AH4-AH5) for loss of ego boundary symptoms, and V5 (DL5-TH7) for mania symptoms respectively. . They are named V1 (TH3-BE2) for thought disorder symptoms, V2 (NA6-ND2) for negative symptoms, V3 (DL1-DL8) for auditory hallucination symptoms, V4 (AH4-AH5) for loss of ego boundary symptoms, and V5 (DL5-TH7) for mania symptoms respectively.
|