|
1 Introduction
Correlation
coefficient matrices are among the most well-studied topics in Statistics. But
consider the following problem. For any p by p matrix D, define  to be the p by p matrix whose ijth entry equals the Pearson's correlation
coefficient for the ith and the jth columns of D:
to be the p by p matrix whose ijth entry equals the Pearson's correlation
coefficient for the ith and the jth columns of D:
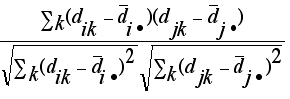 . .
Where  denotes the ikth entry of D,
  denotes the mean
  . .
What will happen if we apply this correlation operator
 to a matrix D iteratively to obtain the sequence to a matrix D iteratively to obtain the sequence
 , n=1,2,…? , n=1,2,…?
Will the sequence converge?
If so, what does it converge to?
Surprisingly, such natural mathematical questions do not admit an easy solution in the literature yet. Our interest in such convergence problem stems from the needs of developing informative visualization tools in analyzing data collected for studying the grouping structure among the schizophrenic symptoms and patients (Lin, Chen,
Hwu, Lin, and Chen, 1997). The description of this data will be given later in the end of this section
(Section 1.1). In general, we can take D to be any proximity matrix; see Section 2.1 for a brief review.
 is used to denote D when D itself is a correlation matrix. is used to denote D when D itself is a correlation matrix.
One
way of studying such a correlation matrix series is through visualization. To
do so, for each matrix  ,
we project the p column vectors of ,
we project the p column vectors of  onto the plane spanned by the first two eigenvectors of
  .
We did this for the sequence obtained by taking D to be the correlation
matrix for the aforementioned schizophrenic data. Figure 1 gives the projections
of, for
n=0,1,…,11. As we can see a clear elliptical clusters begin to form
at step n=4. .
We did this for the sequence obtained by taking D to be the correlation
matrix for the aforementioned schizophrenic data. Figure 1 gives the projections
of, for
n=0,1,…,11. As we can see a clear elliptical clusters begin to form
at step n=4.
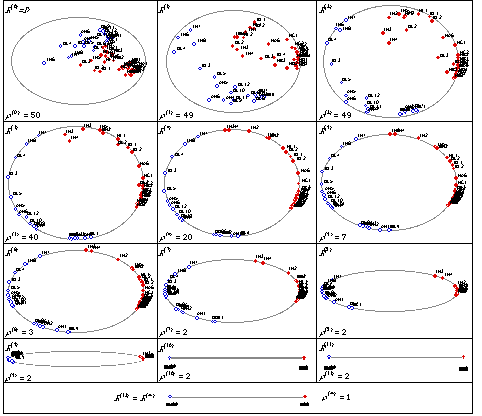
Figure
1. Plots for Eigenvectors (First Two) and Eigenvalues for each Correlation Matrix.
( is the Rank of
  ). ).
One of our goals in this paper is to provide a theoretical explanation for the formation of such elliptical clustering patterns which appear quite common as we test our procedure on many examples. This is given in Section 3 and Section 4. In Section 5, we further explore the clustering pattern discovered earlier and use it as a new way to construct a new seriation algorithm. For a brief review on seriation problem, see Section 2.2. A double sorted raw data matrix map and related concept are introduced in Section 6 with some concluding remarks given in Section 7. We now give a brief description of the psychosis disorder
data.
1.1 The Psychosis Disorder
Data
The properties of the convergent sequence of correlation matrices and the GAP package were developed while analyzing a data set from the Taiwan multidimensional psychopathological group research program
(MPGRP) (Lin, Chen, Hwu, Lin, and Chen, 1998). The data set consisted of the
Andreasen’s positive and negative symptom scales
(`Andreasen (1983), and (1984)) of 95 first-time hospitalized psychosis disorder patients. Among the 95 patients, 69 patients were diagnosed as schizophrenic and 26 patients as bipolar disorders.
The system of Andreasen’s symptom scales include the Scale for Assessment of Positive Symptoms (SAPS) with 30 items and the Scale for Assessment of Negative Symptoms (SANS) with 20 items (see Appendix). SAPS includes four subgroups: hallucinations (AH1-6), delusions (DL1-12), behavior (BE1-4) and thought disorder (TH1-8). SANS has five subgroups: expression (NA1-7), speech (NB1-4), hygiene (NC1-3), activity (ND1-4) and inattentiveness (NE1-2). The available data set has ninety-five subjects (patients) with fifty variables (symptoms). All the symptoms are recorded on a six-point scale (0-5).
Psychiatrists in the MPGRP have addressed three fundamental issues: the grouping structure among the symptoms, the clustering structure of patients and the general behavior of patient-cluster on each symptom-group. These three issues are closely related to the three major pieces of information contained in any multivariate data set:
-
the linkage amongst n subject points in the p-dimensional space;
-
the linkage between p variable vectors in the n-dimensional space;
-
the interaction linkage between the sets of subjects and variables.
Factor analysis and clustering methods are commonly applied to answer the first two issues but there is no general technique for studying the interaction effect for subjects and variables. In the present study, we begin with the first issue: the grouping structure among the symptoms. Thereafter, the last two issues on the clustering structure of patients and the general behavior of patient-clusters on each symptom-group are considered.
Reference:
-
Andreasen, N. C. (1983), "The Scale for the Assessment of Negative Symptoms (SANS)," University of Iowa, Iowa City, IA.
-
Andreasen, N. C. (1984), "The Scale for the Assessment of Positive Symptoms (SANS), "University of Iowa, Iowa City, IA.
-
Andreasen, N. C., Arndt, S.,
Alliger, R., Miller, D., Flaum, M. (1995), "Symptoms of schizophrenia: methods, meanings, and mechanisms." Archive of General Psychiatry, 52, 341-351.
-
Breiger, R. L.,
Boorman, S. A. and Arabie, P (1975), "An Algorithm for Clustering Relational Data with Applications to Social Network Analysis and Comparison with Multidimensional Scaling," Journal of Mathematical Psychology, 12, 328-383.
-
Lin, A. S., Chen, C. H., Hwu H. G., Lin H. N., and Chen J. A. (1998), "Psychopathological Dimensions in Schizophrenia: A Correlational Approach to Items of the SANS and SAPS," Psychiatry Research, 77, 121-130.
-
McQuitty, L. L. (1968), "Multiple Clusters, Types, and Dimensions from Iterative Intercolumnar Correlational Analysis," Multivariate Behavioral Research, 3, 465-477.
|