Covariate-adjusted matrix visualization via correlation decomposition
Han-Ming Wu1,Yin-Jing Tien2, Meng-Ru Ho3, 4, 5, Hai-Gwo Hwu6, Wen-chang Lin5, Mi-Hua Tao5, and Chun-Houh Chen2,*
1Department of Mathematics, Tamkang University, Taipei County 25137,
Taiwan, R.O.C.,
2Institute of Statistical Science, Academia Sinica, Taipei 11529,
Taiwan, R.O.C.,
3Institute of Biomedical Informatics, National Yang-Ming University,
Taipei 112, Taiwan, R.O.C.,
4Bioinformatics Program, Taiwan International Graduate Program,
Academia Sinica, Taipei 115, Taiwan, R.O.C.,
5Institute of Biomedical Sciences, Academia Sinica, Taipei 115,
Taiwan, R.O.C.,
6Department of Psychiatry, National Taiwan University Hospital and
College of Medicine, Taipei 100, Taiwan, R.O.C.
and Department of Psychology, College of Public Health, Neurobiology and
Cognitive Science Center, Taipei 100, Taiwan, R.O.C.
*to whom correspondence should be addressed.
Abstract
Motivation:
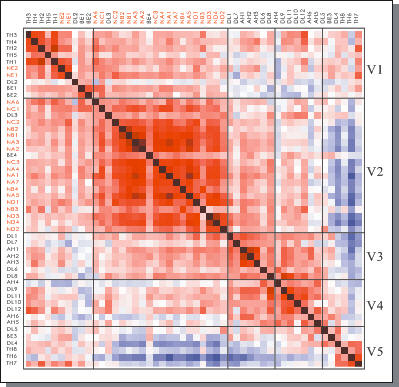
In this study, we extend the framework of matrix visualization (MV) by
incorporating a covariate adjustment process through the estimation of
conditional correlations. MV can explore the embedded information structure of
high-dimensional large-scale data sets effectively without dimension reduction.
The benefit of the proposed covariate-adjusted MV is in the exploration of
conditional association structures among the subjects or variables that cannot
be done with conventional MV.
Results:
For adjustment of a discrete covariate, the conditional correlation is estimated
by the within and between analysis. This procedure decomposes a correlation
matrix into the within- and between-component matrices. The contribution of the
covariate effects can then be assessed through the relative structure of the
between-component to the original correlation matrix while the within-component
acts as a residual. When a covariate is of continuous nature, the conditional
correlation is equivalent to the partial correlation under the assumption of a
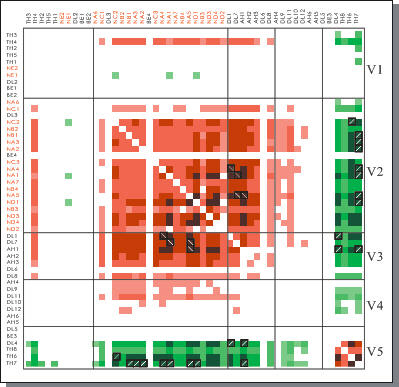
joint normal distribution. A test is then employed to identify variable pairs
which possess the most significant differences at varying levels of correlation
before and after a covariate adjustment. In addition, a z-score significant map
is constructed to visualize these results. A simulation and three data sets are
employed to illustrate the power and versatility of our proposed method.
Availability:
GAP is available to registrants and is free to non-commercial
applications. The installation instructions, the User's Manual, and the
detailed tutorials are available at
http://gap.stat.sinica.edu.tw/Software/GAP.
Contact:
cchen@stat.sinica.edu.tw
Supplementary
information: Supplementary material are available at
Bioinformatics online.
Examples:
Last Update: 2011/03/14, hmwu@mail.tku.edu.tw