Generalized Association Plots (GAP) and Methodological Innovation


- Kwon OH, Kao CH, Chen CH, and Ma KL (2022), A Deep Generative Model for Reordering Adjacency Matrices, IEEE Transactions on Visualization and Computer Graphics, doi: 10.1109/TVCG.2022.3153838
- Wu HM, Kao CH, and Chen CH (2020), Dimension reduction and visualization of symbolic interval-valued data using sliced inverse regression, Advances in Data Science: Symbolic, Complex and Network Data, Diday E, Guan R, Saporta G, Wang H (eds). London: Wiley-ISTE, 49-78
- Wu HM, Tien YJ, Ho MR, Hwu HG, Lin WC, Tao MH, Chen CH* (2018), Covariate-adjusted heatmaps for visualizing biological data via correlation decomposition, Bioinformatics, 34(20), 3529-3538
- Kao CH, Nakano J, Shieh SH, Tien YJ, Wu HM, Yang CK, and Chen CH* (2014). Exploratory data analysis of interval-valued symbolic data with matrix visualization, Computational Statistics and Data Analysis, 79 (2014), 14-29
- Wu HM, Tien YJ, and Chen CH* (2010). GAP: A graphical environment for matrix visualization and cluster analysis, Computational Statistics and Data Analysis, 54 (3), 767-778
- Tien YJ, Lee YS, Wu HM, and Chen CH* (2008). Methods for Simultaneously Identifying Coherent Local Clusters with Smooth Global Patterns in Gene Expression Profiles, BMC Bioinformatics, 9:155
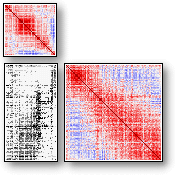
- Chen CH (2002). Generalized Association Plots for Information Visualization: The applications of the convergence of iteratively formed correlation matrices, Statistica Sinica, 12, 1-23
- Chen CH, and Li KC (2001). Generalization of Fisher's Linear Discriminant Analysis via the Approach of Sliced Inverse Regression, Journal of the Korean Statistical Society, 30, 193-217
- Chen CH, and Chen JA (2000). Interactive Diagnostic Plots for Multidimensional Scaling with Applications in Psychosis Disorder Data Analysis, Statistica Sinica, 10, 665-691