|
5.5 The Elliptical Structure with the Eigenvalue Decomposition of the Correlation Matrices
We proved in Section 3.4 that every correlation matrix
 in the converging sequence has all the column vectors fall on the in the converging sequence has all the column vectors fall on the
 -dimensional ellipsoid generated by the inverse or generalized inverse matrix of -dimensional ellipsoid generated by the inverse or generalized inverse matrix of
 . It is impossible for us to display the complete ellipsoid structure for each correlation matrix in the sequence unless it reaches the rank-two ellipse status. Instead, the leading two eigenvectors with their corresponding two-dimensional ellipse for each iteration is plotted in Figure 1. . It is impossible for us to display the complete ellipsoid structure for each correlation matrix in the sequence unless it reaches the rank-two ellipse status. Instead, the leading two eigenvectors with their corresponding two-dimensional ellipse for each iteration is plotted in Figure 1.
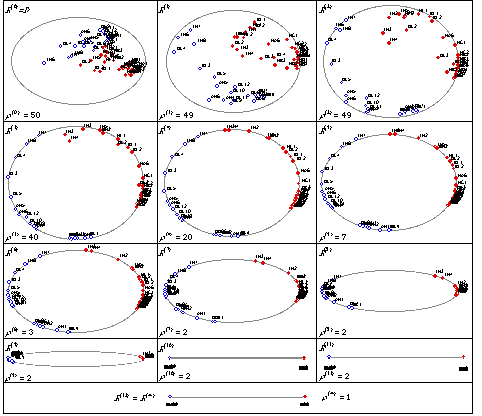
Figure 1. Plots for Eigenvectors (First Two) and Eigenvalues for each Correlation Matrix. ( is the Rank of is the Rank of
 ). ).
Each plot in Figure 1 can only explain
 of the total variation at that particular matrix. If a data point falls exactly on the ellipse, then these two eigenvectors carry 100% information for that point at that iteration, seen in the negative symptom group in Figure 1 of the total variation at that particular matrix. If a data point falls exactly on the ellipse, then these two eigenvectors carry 100% information for that point at that iteration, seen in the negative symptom group in Figure 1 for example; whereas when a data point falls well inside the ellipse, the information for that point must be contained in the rest of the eigenvectors, see TH4 in Figure 1. At for example; whereas when a data point falls well inside the ellipse, the information for that point must be contained in the rest of the eigenvectors, see TH4 in Figure 1. At
 , where the rank equals to two, all fifty columns fall exactly on the ellipse and the plot carries 100% information for that iteration. From , where the rank equals to two, all fifty columns fall exactly on the ellipse and the plot carries 100% information for that iteration. From
 to to  , these points move towards the two vertices along the curve of the ellipse. , these points move towards the two vertices along the curve of the ellipse.
The rank for  is two but the first two eigenvalues are 49.999998348201 and 1.6517994E-6 respectively, the second eigenvalue not much larger than the zero criterion
 we defined. Thereafter, both the groups of points in Figure 1 are magnified and plotted in Figure 10b and 10c. From these two figures it is clearly seen that all the data points fall on an ellipse. The grouping structure similar to that in
is also kept in these two we defined. Thereafter, both the groups of points in Figure 1 are magnified and plotted in Figure 10b and 10c. From these two figures it is clearly seen that all the data points fall on an ellipse. The grouping structure similar to that in
is also kept in these two  -balls. -balls.
Figure 10. The Magnified Views of the Elliptical Structure at
 . .
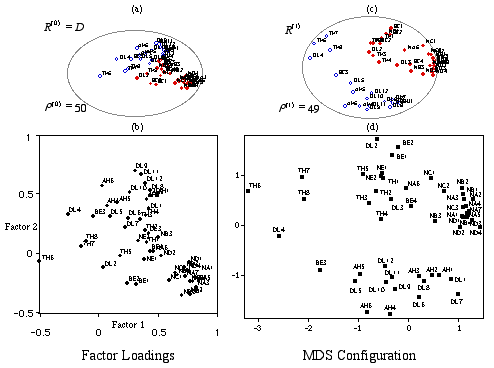
In order to compare the sequence of eigenvector plots to conventional dimension reduction methods, we performed an exploratory factor analysis and a 2-dimensional non-metric multidimensional scaling analysis. While Figure1 mimics the pattern of the scatterplotw for the first 2 factors by definition, the relative positions of points in Figure1 mimics the pattern of the scatterplotw for the first 2 factors by definition, the relative positions of points in Figure1 is extremely similar to the MDS configuration plot. The figures for factor analysis and MDS are available on our web site. An important advantage for Figure is extremely similar to the MDS configuration plot. The figures for factor analysis and MDS are available on our web site. An important advantage for Figure
 over the MDS configuration plot is that the stress contributors (Chen and Chen (2000)) can be easily identified as those points located in the middle of the ellipse. over the MDS configuration plot is that the stress contributors (Chen and Chen (2000)) can be easily identified as those points located in the middle of the ellipse.
Reference:
-
Chen, C, H., and Chen, J. A. (2000), "Interactive Diagnostic Plots for Multidimensional Scaling with Applications in Psychosis Disorder Data Analysis," to appear in Statistica Sinica, 10.
|